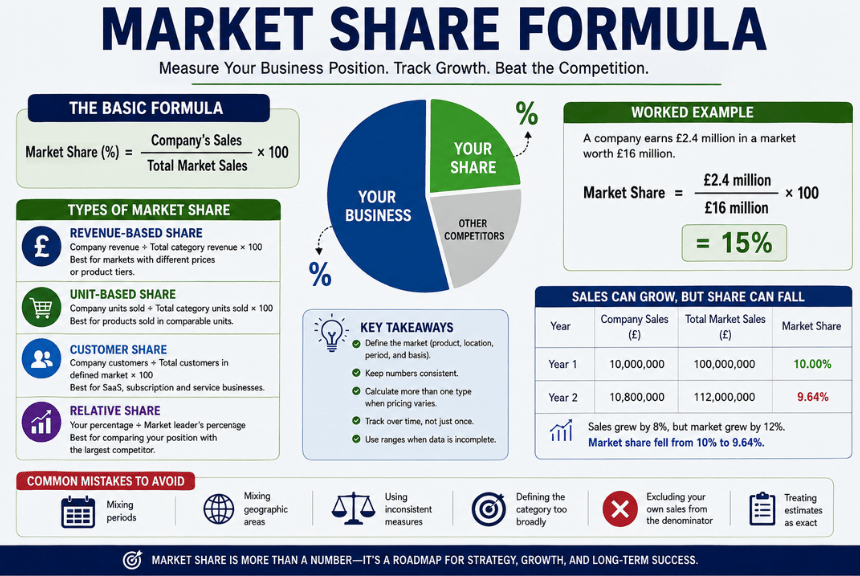
The market share formula is (your company’s sales ÷ total market sales) × 100. Use the same product category, geographic area, measurement basis, and period for both figures. You can calculate the percentage using revenue, units sold, active customers, subscriptions, or another consistent measure. To check the division for your own figures, a what percent of calculator turns any part and whole into a percentage and shows the working.
The calculation looks simple, but choosing the wrong market can produce a misleading result. For example, a UK retailer shouldn’t compare its domestic revenue with worldwide industry sales.
The table below shows the main calculation methods and explains when each works best.
| Measure | Calculation | Best used for | Main caution |
| Revenue-based share | Company revenue ÷ total category revenue × 100 | Markets with different prices or product tiers | Higher prices can increase the result without increasing sales volume. |
| Unit-based share | Company units sold ÷ total category units sold × 100 | Products sold in comparable units | Product sizes and pack formats must match. |
| Customer share | Company customers ÷ total customers in the defined market × 100 | SaaS, subscription, and service businesses | Use active customers for both figures. |
| Relative share | Your percentage ÷ the market leader’s percentage | Comparing your position with the largest competitor | State whether the result is expressed as a ratio or a percentage |
Key Takeaways
- Define the product, location, period, and measurement basis first.
- Keep the numerator and denominator consistent.
- Calculate more than one type of share when pricing varies between competitors.
- Track the result over time rather than relying on a single figure.
- Treat estimates as ranges when industry data is incomplete.
What the Percentage Tells You?

The market share formula shows how much of a defined market belongs to one company, product, or brand. It places your performance beside the total market rather than presenting sales in isolation.
Suppose your annual revenue rises by 8%. That sounds positive. Yet the market may have grown by 12%, which means your competitive position has weakened.
The metric can support several business decisions:
- comparing performance with competitors;
- setting sales and growth targets;
- assessing product or regional strength;
- monitoring brand performance;
- planning budgets and investments.
Brand teams often track changes in this figure alongside customer retention, brand awareness, and campaign results. Scrollex’s explanation of the brand manager role shows how these measures connect with broader brand decisions.
How to Use the Market Share Formula in Four Steps
1. Define the Market Boundary
Decide exactly what you’re measuring. Your definition should cover four points:
- Product: Which product, service, or category counts?
- Location: Is the market local, national, regional, or global?
- Period: Are you measuring a month, quarter, or year?
- Basis: Will you use revenue, units, customers, or transactions?
For example, a coffee shop might measure takeaway coffee revenue within one city. Comparing that shop with all UK food-service revenue would produce a meaningless percentage.
2. Find Your Company Figure
Use your company’s figure for the same market boundary you selected. Suitable sources include accounting records, point-of-sale reports, customer databases, and subscription systems.
Remove unrelated revenue. A business selling laptops and consulting services should include only its laptop revenue when measuring its position in the laptop market.
3. Estimate the Total Market
Find the total sales, units, or customers across all sellers in the defined market. Possible sources include:
- government statistics;
- trade associations;
- market research reports;
- retailer or distributor data;
- competitor financial reports;
- industry surveys.
Complete data can be difficult to obtain in markets that contain many privately owned businesses. Narrow categories and limited private-company data can also make the denominator harder to estimate.
4. Divide and Multiply by 100
Assume a company earns £2.4 million in a market worth £16 million.
£2.4 million ÷ £16 million × 100 = 15%
The company therefore controls 15% of the defined market by revenue.
Record the calculation method beside the result. Writing “15% UK revenue share for calendar year 2025” is more useful than recording “15%” alone.
Revenue, Unit, and Customer Calculations Compared
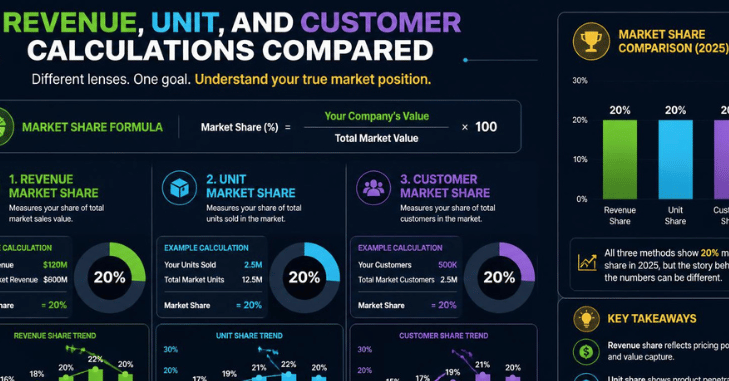
Revenue-based and unit-based results can tell different stories. A premium brand may earn a high percentage of market revenue while selling fewer items than a lower-priced competitor.
Consider this example:
| Result type | Company figure | Total market | Result |
| Revenue | £2.4 million | £16 million | 15% |
| Units | 30,000 | 200,000 | 15% |
| Active customers | 1,800 | 12,000 | 15% |
All three results match in this example. In real businesses, however, they often differ.
Suppose the company held 18% of market revenue but only 12% of unit sales. That difference could suggest that its average selling price is above the market average.
The reverse could indicate discounting, smaller pack sizes, or a lower-priced product mix. These differences can guide pricing and positioning decisions.
Worked Example: Sales Can Grow While Market Share Falls
A company earns £10 million in a £100 million market during the first year.
Year-one result: £10 million ÷ £100 million × 100 = 10%
During the second year, company revenue rises to £10.8 million. The overall market grows to £112 million.
Year-two result: £10.8 million ÷ £112 million × 100 = 9.64%
Sales increased by 8%, but the company’s share fell from 10% to approximately 9.64%. The business grew more slowly than the market as a whole.
This distinction helps leaders separate internal growth from competitive performance. Rising sales can coincide with a declining percentage when the wider market grows faster.
Your next step should depend on the reason for the decline. The issue may involve distribution, pricing, customer retention, product quality, or weak differentiation.
The Scrollex comparison of operational effectiveness and strategy can help separate internal process problems from broader positioning decisions.
Relative Market Share Compared with the Market Leader
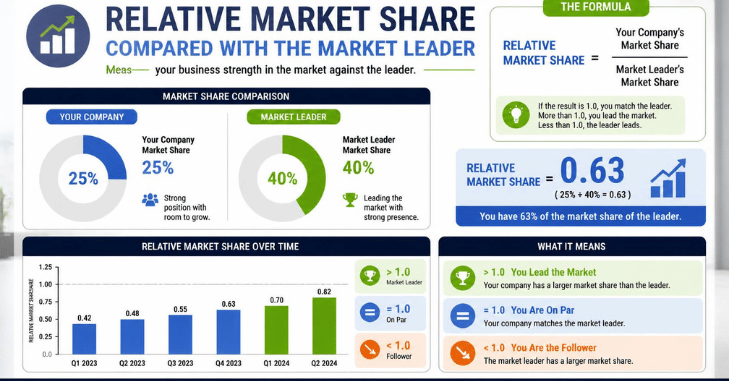
Relative market share compares your percentage with that of the largest competitor.
Relative share = your percentage ÷ the market leader’s percentage
Assume your business controls 15% of the market while the leader controls 30%.
15% ÷ 30% = 0.5
Your business holds half the market share of the leader. This result can be expressed as 0.5 times or 50%, provided that the reporting format is stated clearly.
A ratio above 1.0 means that your company leads the defined market. A ratio below 1.0 shows the distance between your position and that of the leader.
This comparison can be more useful than an isolated percentage because it shows how far your company must grow to match its strongest competitor.
How to Estimate the Total Market When Data Is Limited
You may need to produce an estimate when no complete industry report exists. Start with the most reliable data available and document every assumption.
One method is to combine known competitor revenue with an estimate for smaller sellers. Another method uses customer counts, store numbers, website traffic, or transaction volume.
You can also build a bottom-up estimate:
- Estimate the number of potential buyers.
- Estimate the average number of purchases per buyer.
- Estimate the average sale value.
- Multiply those figures to calculate annual demand.
For example, a town with 20,000 likely buyers might average three purchases worth £40 each.
20,000 × 3 × £40 = £2.4 million in estimated annual demand
Use a range when the inputs are uncertain. An estimate of £2.1 million to £2.7 million gives decision-makers more context than a potentially misleading single figure.
Businesses that need outside research support may also compare the different types of consulting, including strategy, sales, and financial advisory services.
Common calculation mistakes
Mixing Periods
Don’t divide quarterly company sales by annual industry sales. Both figures must cover the same period.
Mixing Geographic Areas
UK revenue should be compared with UK market revenue. Don’t use European or global totals unless the company figure covers the same region.
Using Inconsistent Measures
Revenue can’t be divided by unit volume. A customer count can’t be divided by a transaction count.
Defining the Category Too Broadly
A vegan meal-delivery service may compete in the vegan delivery, prepared-meal, or wider takeaway market. Each definition produces a different result.
Excluding Your Own Sales From The Denominator
Total market sales should include every seller, including your company. Leaving your own figure out of the denominator inflates the result.
Treating Estimates As Exact Data
Industry estimates often contain sampling gaps and reporting delays. Record the source, date, and assumptions behind each calculation.
How To Interpret Changes in Market Share
A rising result can mean that your company is growing faster than its competitors. It may follow improved distribution, stronger customer retention, a successful launch, or an acquisition. A falling result also requires context. A rapidly growing market might cause it, aggressive competitor pricing, supply problems, or a deliberate withdrawal from low-margin business.
Don’t assess the percentage alone. Compare it with:
- revenue growth;
- unit growth;
- gross margin;
- customer retention;
- average selling price;
- total market growth;
- competitor activity.
A company could gain market share by cutting prices while damaging its profit margin. Another company might lose low-value sales volume while improving profitability.
The goal isn’t always to capture the largest possible percentage. It is to support a sound competitive position and profitable growth. Scrollex’s article on sustainable competitive advantage provides further context on protecting a business position over time.
Add the calculation to your reporting cycle
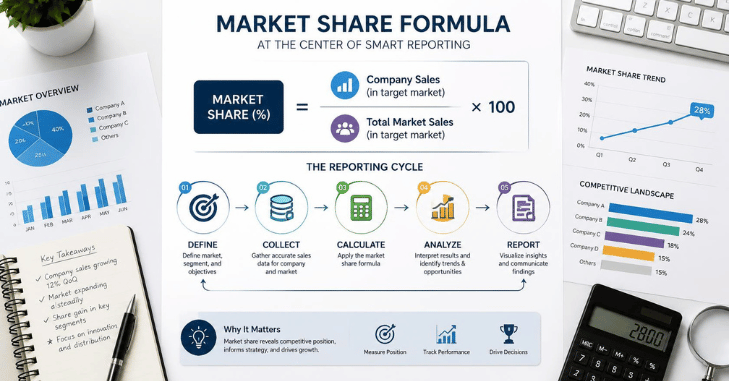
Create a simple monthly, quarterly, or annual worksheet with the following fields:
- market definition;
- company figure;
- total market figure;
- calculation basis;
- resulting percentage;
- previous-period result;
- data sources;
- assumptions and confidence range.
Use the same definition during each reporting period. Changes in market boundaries can create false trends. Share the result with your sales, finance, marketing, and product teams. Each group may identify a different reason behind a gain or decline.
Conclusion
The market share formula is more than a simple percentage—it is a practical tool for measuring your competitive position, tracking business performance, and making informed strategic decisions. Whether you calculate market share using revenue, units sold, customers, or relative share, the key is to define your market consistently and compare figures from the same period and geographic area. By monitoring market share regularly, checking for common calculation mistakes, and interpreting results alongside sales growth and profitability, businesses can identify opportunities, respond to competitors, and build a stronger long-term market position.
Frequently Asked Questions
Divide your company’s sales by total market sales for the same category, region, and period. Multiply the result by 100 to express it as a percentage.
Use revenue when prices differ across products or competitors. Use units when the products are directly comparable. Calculating both often provides the clearest picture.
There is no universal target. A useful benchmark depends on the market, number of competitors, profit margins, growth rate, and the market leader’s position.
No. A result above 100% indicates a data or market-boundary error. Check the denominator, dates, geographic area, and measurement basis.
Monthly reporting may suit fast-moving retail or subscription businesses. Quarterly or annual calculations may be more suitable for slower-moving industries with limited data.
Absolute market share compares your business with the entire defined market. Relative market share compares your result with that of the leading competitor.
Yes. Small businesses can use local sales figures, customer counts, trade data, and reasonable market estimates. The assumptions behind the calculation should be recorded and reviewed regularly.